Risk policy provides a way to make logical, consistent trade-offs between risk and value.
Daniel Bernoulli established a mathematical foundation for utility functions in 1738. "Utility" is a term economists and psychologists use to describe value. A utility function, or curve, translates an objective measure, say $ or NPV $, into how the person feels about that quantity.
Bernoulli surveyed people and found that, unsurprisingly, they are risk-averse. He posited that one's risk tolerance is approximately proportional to wealth. No surprise: wealthy people are more able to tolerate more risk.
While there are competing formulas for utility functions, the "exponential utility function" (EUF) is the most practical. It is named for the exponential term in the formula. EUF is the easiest and most consistent expression of risk attitude and, hence, risk policy.
I recommend this equation form:
where:
| U = | utility value in risk-neutral dollars (RN$) (in the U.S. and other countries using the $ symbol) |
| x = | objective outcome value, usually NPV $ |
| r = | risk tolerance coefficient, typically on the order of 1/5 of the decision maker’s or organization’s net worth |
There are at least two other EUFs that are equivalent but have less meaningful units.
An aside: The EUF equation, above, is similar to the exponential equation for present value discounting that appears in many textbooks..
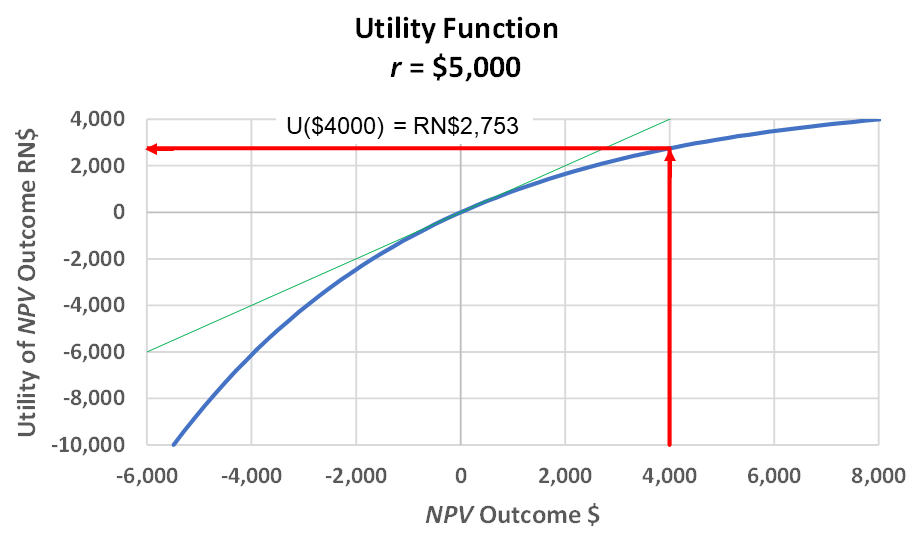
Here is an EUF scaled for r = $5,000:
Exponential Utility Function. This
concave function
represents a complete risk policy if the
outcomes are objectively valued in
NPV
or
NPV-equivalents.
The 45° line is for reference
and is the utility function for a risk-neutral person. The red arrows show determining
the utility of $4,000 NPV. The Excel equation is =5000*(1-EXP(-4000/5000)), which returns RN$2,753.
An aside: There are other possible utility functions. Mathematicians can be very creative and elaborate. Reseachers have elicited utility preferences with a step-sequence of lotteries or by looking at historical decisions. Most produce abysmal curves—not very workable, in my opinion.
Only an EUF has:
Though not unique to EUF, it is convenient that a positive outcome has positive utility, and a negative outcome has a negative utility.
r is just a scaling factor that determines the curvature of the utility function. On average, people with 10 times as much wealth have r 's 10 times as high. Conceptually, Warren Buffet and I have the same utility curve shape. Mr. Buffet's utility function just has much larger numbers on his x- and y-axis scales.
The EUF has utility units in "risk-neutral dollars" (RN$). Here are examples relating utility units to dollars:
Expected value utility is the probability-weighted utility outcome. I conform to common practice and call this expected utility with the abbreviation EU.
The expected utility decision rule is: Choose the alternative with the highest r.
Though this is sufficient for decision making, I recommend one more step: Convert rs to certain equivalents (CEs). The CE is the cash-in-hand value of a risk.
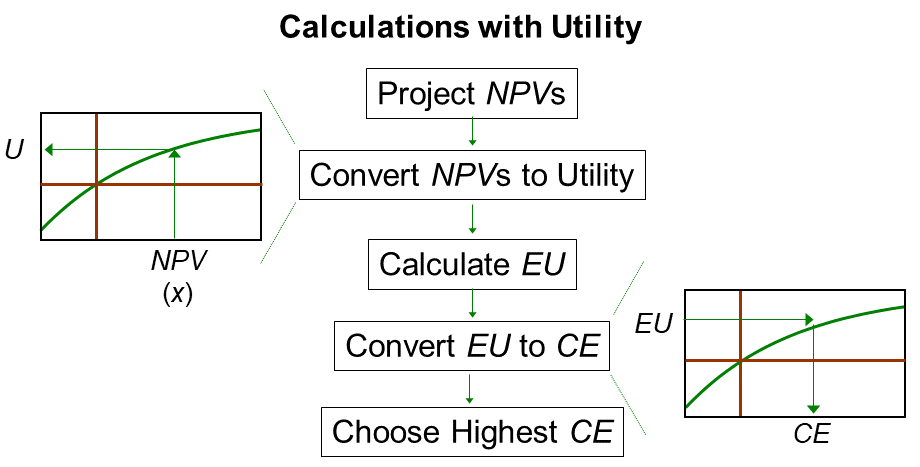
The Analysis Process with Utility.
Here are the steps:
The inverse equation, translating EU into CE is:
The meaning of CE:
The EUF has constant risk aversion and features:
Determining r is typically through “lottery” experiments. The link takes you to one example.
Utility Elicitation Program is a free (for most users) automated tool to help you self-assess r's through several lottery types. Access UEP at http://www.maxvalue.com/online.htm.
© 2020 John R. Schuyler. www.maxvalue.com