Go to the Prior Tip
How to Measure Anything: Finding the Value of Intangibles in Business
Go to the Next Tip
This Time is Different: Eight Centuries of Financial Folly
by Reinhart and Rogoff
Return to MaxValue Home Page
This book needed writing. Doug Hubbard convincingly makes the case with abundant examples that risk management has failed. Memorable examples include anecdotes about:
Fixing risk management isn’t difficult. It’s mostly about modeling uncertain systems. Express judgments as probability distributions and employ Monte Carlo simulation to do the calculations. Be a scientist: Look outward for available input data and for model validation. Recognize risk and decision analysis as valuable profession that warrants certification.
I enjoyed humor in the book. He favors short over long and definitions. He forsakes a long, formal definition of risk management, in favor of this shorter definition: “Being smart about taking chances.” Regarding the recently-popular term, enterprise risk management, he warns that adding enterprise means more expensive. In reference to management’s ill-placed attraction to scoring methods, he writes, “If you call it a score, it will sound more like golf, and it will be more fun for them.” The title of chapter 7 is “Worse Than Useless: The Most Popular Risk Assessment Method and Why It Doesn’t Work.”
The book is superbly written, designed and edited. The straightforward organization includes three parts:
High points for me were the sections about the history of risk management, debunking popular scoring methods that are worse than useless, calibration tests (short, illuminating exercises for the reader to do), human biases, the current financial crisis (there will always be a next crisis), and near-misses as potential-failure warnings (e.g., foiled terrorism plots).
I wish the book or its associated website 1) included more calculation examples (he's working on additions), 2) recognized decision tree analysis as a calculation alternative(sometimes preferable to simulation), and 3) provided stronger guidance about improving decision policy.
Hubbard provides abundant citations and references as take-off points for the interested reader to pursue. His first book, How to Measure Anything (Wiley, 2000), is built upon—though not prerequisite—and provides additional detail about assessing (measuring) uncertainties.
In another generation perhaps this book will be unnecessary. As soon as kids learn fractions, they can start learning about probability—the language of uncertainty. The techniques in the book should become mainstream and part of every numerically-literate person’s toolkit. Then, the “Introduction to the Crisis” and “Why It’s Broken,” Parts 1 and 2, will be only of historical interest. Once people and organizations recognize risk management as routine, the needed instruction will be about good risk assessment and modeling practice.
Five stars! In my opinion, most any professional, especially in management, should read this book.
Many disaster distributions plot as a line on a chart: Log(frequency) vs. Log(impact). Impact can be measured in number of lives lost, financial loss, Richter scale (earthquakes), size of meteors, etc. Doug Hubbard describes these on pages 184-187.
Doug's website for this book has spreadsheets to show sampling for the power-law distribution and others.
![]()
where: Impact = size of the event
RN = random number, sampled from a uniform distribution, U(0,1)
λ = (lambda) slope of the Frequency vs Impact line on a log-log chart
a = y-axis offset for the line (can be non-zero if needed)
The chart shows the Power-Law distribution for a = 0 and l = -.5. The black points summarize 100,000 samples using the formula above, ant the blue, green, and red points extend the line line with greater resolution for the low-probability, high-impact events.
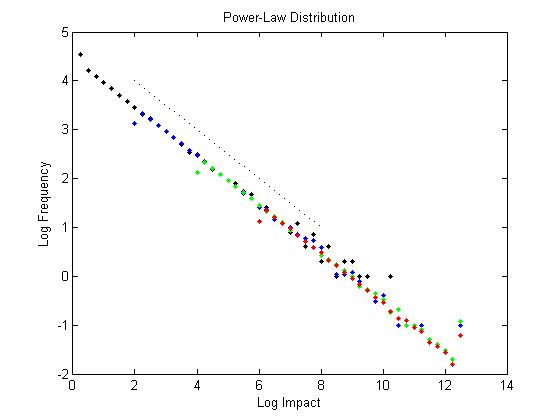
Hubbard notes (page 219) that agent-based modeling often produces such distributions. See Tip 017 (Agent-Based Simulation) and Tip 066 (Ant Models).
—John Schuyler, July 2009. Revised 16-Apr-12
Copyright \A9 2009-2013 by John R. Schuyler. All rights reserved. Permission to copy with reproduction of this notice.